📱 App Network Debugger
Real-time HTTP/HTTPS & Mobile Analytics Inspector for iOS & Android
A lightweight, standalone desktop proxy and network debugging tool designed specifically for mobile developers. Capture, inspect, and analyze live HTTP/HTTPS traffic, WebSockets, and native binary analytics payloads (Firebase & Branch) in real-time.



✨ Key Features
| ⚡ Smart Analytics Inspector | 📱 Zero-Config Mobile Proxy |
|---|---|
| • Firebase Native Protobuf Decoding: Automatically parses binary analytics payloads into human-readable events. • E-Commerce & Items Breakdown: Inspect view_item, add_to_cart, begin_checkout with nested product items, SKU, price, and category.• Hero Parameter Chips: Key metadata ( Screen, Category, Location, Currency, Value) spotlighted at a glance.• Real-time Event Search: Filter events instantly by name or parameter value. | • Auto IP Detection: Automatically finds your computer's local LAN IP for seamless mobile proxy configuration. • 1-Tap Certificate Setup: Scan a local QR code on your phone or visit http://mitm.it to install the SSL certificate.• Pause Mode: Temporarily pause recording without disconnecting proxy forwarding, keeping your phone online. • Persistent CA: Reuses a private per-installation CA so you don't have to reinstall certs across app restarts. |
| 📦 HAR 1.2 Export & Replay | 🛡️ Privacy & Local-First |
|---|---|
• Standard HAR 1.2 Format: Export selected or all captured flows into .har archives.• Tool Interoperability: Re-open exported archives in Chrome DevTools, Postman, or Charles. • Session History: Automatically persists captured sessions locally in SQLite to review past debugging sessions. • Full Fidelity: Preserves duplicate headers, query strings, Base64 payloads, timings, and WebSocket frames. | • Automatic Redaction: Mask passwords, bearer tokens, cookies, and sensitive headers before displaying or exporting. • 100% Local: No captured packets or mobile analytics are ever transmitted to any third-party cloud servers. • Standalone Desktop App: Everything is bundled into a single desktop package—no separate Python or mitmproxy installations required. |
📸 Interface Showcase
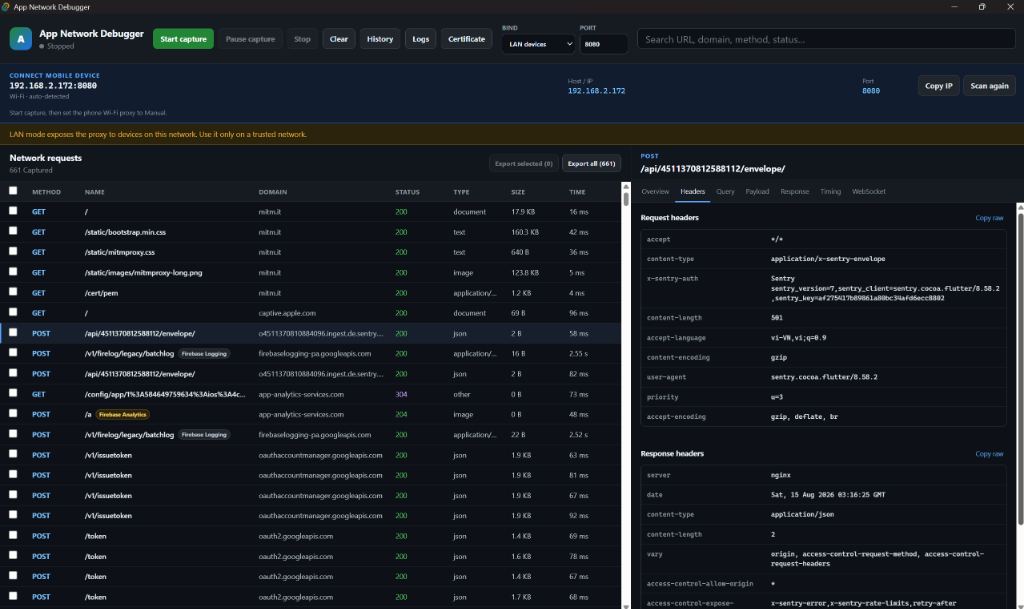
🌐 Network Traffic & Headers Inspection
Inspect complete HTTP/HTTPS requests, status codes, query strings, headers, and timing in real time.
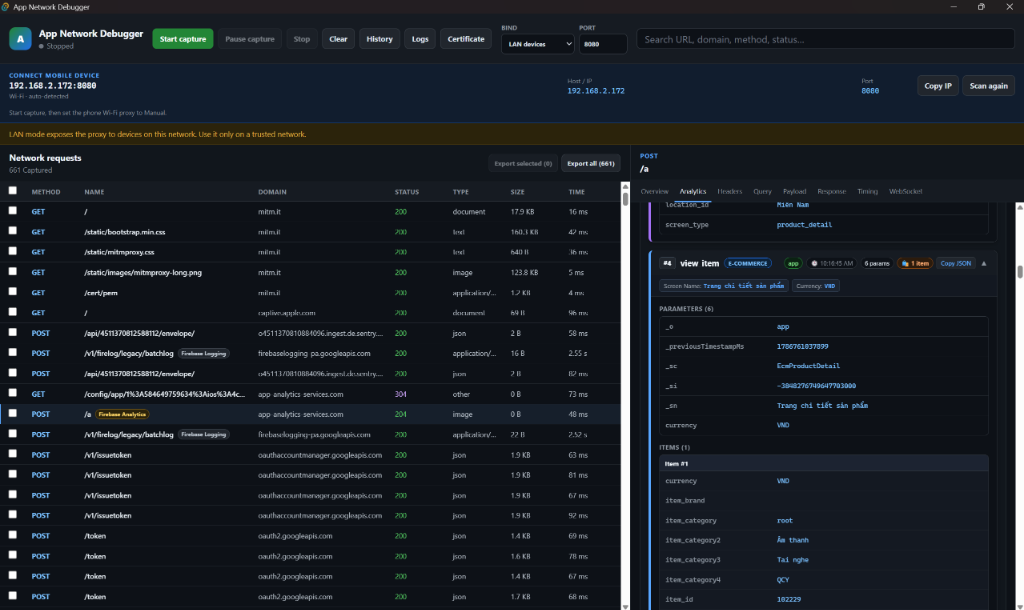
⚡ Native Firebase Analytics Decoding
Automatically unpacks binary Protobuf streams into color-coded event cards, hero parameter chips, and structured e-commerce items.
🔍 How It Works
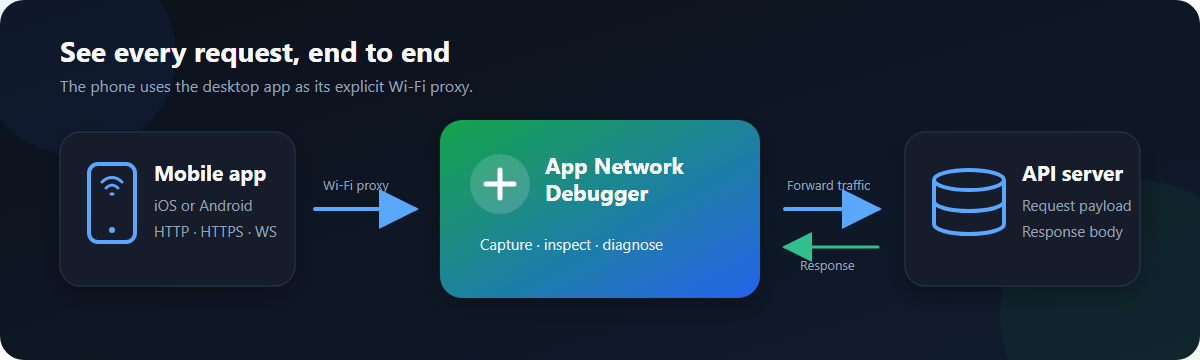
- Proxy Capture: Your mobile phone sends HTTP/HTTPS/WebSocket traffic through the local proxy server running on your computer.
- Real-time Inspection: The desktop interface captures URLs, methods, headers, status codes, payload bodies, and timing in real time.
- Analytics Engine: The built-in analyzer inspects binary Protobuf streams (Firebase Analytics / Google Analytics) and surfaces structured events into interactive cards.
[!TIP]
💡 Pro-Tip: Real-time Firebase Analytics Debugging on Mobile
By default, the Firebase Mobile SDK buffers events locally and flushes them in batches every 1 hour to save battery. To see events appear in real-time as you tap on the phone:
- Android: Connect via USB and run:
bash
adb shell setprop debug.firebase.analytics.app <your.app.package.id> - iOS: Pass
-FIRDebugEnabledin Xcode launch arguments. - Quick Flush: Simply swipe the app to the Background (Home screen); Firebase SDK will immediately flush its queued events to the desktop debugger!
🚀 5-Step Quick Start
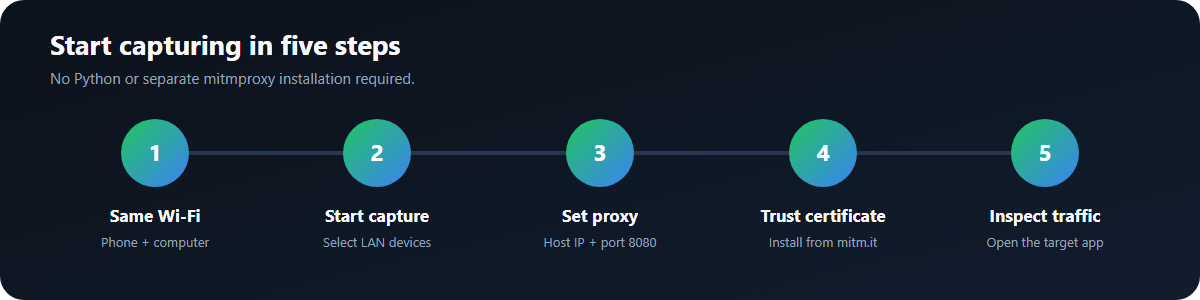
- Connect to Same Wi-Fi: Ensure your mobile device and computer are on the same Wi-Fi network.
- Start Capture: Open App Network Debugger, choose LAN devices, and click Start capture.
- Set Mobile Proxy: In your phone's Wi-Fi settings, set Proxy to Manual. Enter the Host / IP and Port (
8080) shown on the desktop app. - Install Certificate: Click Certificate on desktop and scan the QR code (or open
http://mitm.itin mobile Safari) to install the CA certificate.- Step 4a (Install Profile): Open Settings → VPN & Device Management (or Profile Downloaded) → select mitmproxy → tap Install.
- Step 4b (Enable Full Trust): Open Settings → General → About → Certificate Trust Settings → toggle Enable Full Trust for Root Certificates for mitmproxy.
- Inspect Live Traffic: Open the mobile app you want to test and watch requests and analytics stream in!
[!NOTE] Some applications ignore system proxies or implement SSL certificate pinning. This debugger is designed for authorized testing of your own applications and development builds.
📥 Download & Installation
Windows (x64)
| File | Type | Link |
|---|---|---|
| Setup Installer (Recommended) | .exe | Download App-Network-Debugger_0.1.9_windows-x64-setup.exe |
| Enterprise MSI Package | .msi | Download App-Network-Debugger_0.1.9_windows-x64.msi |
| Checksum Verification | .txt | Verify SHA256SUMS.txt |
| All Releases | GitHub | View GitHub Releases Page |
[!NOTE] Windows SmartScreen Prompt: The installer is an open-source tool and is not yet code-signed with a paid Microsoft certificate. On first launch, if Windows SmartScreen appears, click More info → Run anyway to start.
📄 License
MIT © hdz1210